☔ Total annual precipitation averages 1119 mm (44.1 inches) which is equivalent to 1119 Litres/m² (27.45 Gallons/ft²).
Simply paste the following HTML code into your webpage. Please include a link back to this website. There is one in the following code already. Edit the width attribute to change the size of the graph if needed:
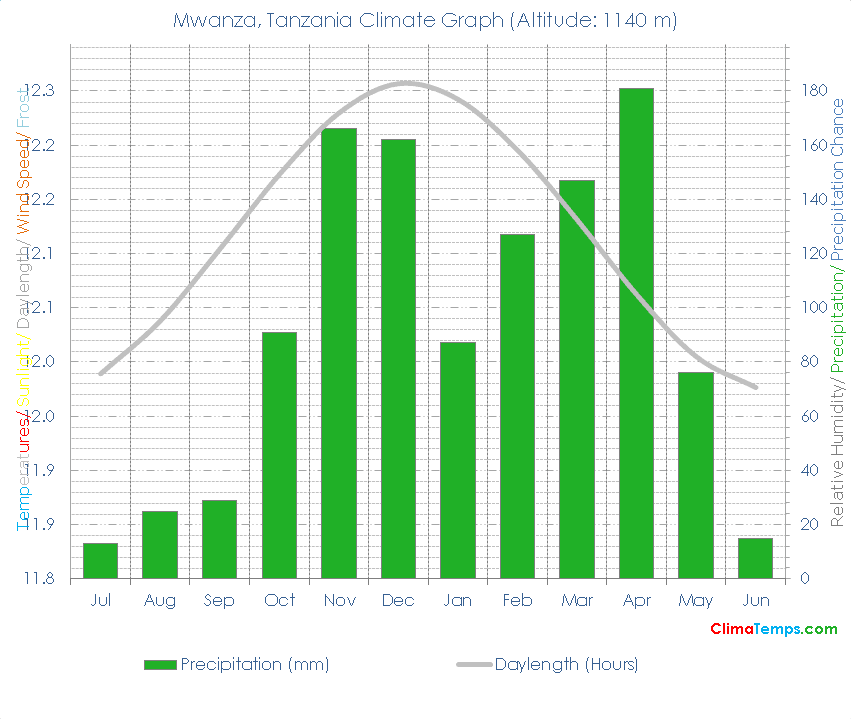
✨ The longest day of the year is 12:08 long on the 21 of December and the shortest day is 11:51 long on the 22 of June.
🐇Were you to burrow down through the centre of the Earth from Mwanza you would pop up nearest to the climate station at Napari, Tabuaeran, Kiribati where you would find a Tropical wet climate.
🌍Mwanza, Tanzania is at 2°28'S, 32°54'E, 1140 m (3740 ft). Check the location on the map.
| Climate Variable | Jul | Aug | Sep | Oct | Nov | Dec | Jan | Feb | Mar | Apr | May | Jun | Annual | ||
|---|---|---|---|---|---|---|---|---|---|---|---|---|---|---|---|
| Average Precipitation mm (in) | 13 (1) | 25 (1) | 29 (1) | 91 (4) | 166 (7) | 162 (6) | 87 (3) | 127 (5) | 147 (6) | 181 (7) | 76 (3) | 15 (1) | 1119 (44) | ||
| Average Daylight Hours/ Day | 11h 59' | 12h 02' | 12h 06' | 12h 10' | 12h 13' | 12h 15' | 12h 14' | 12h 11' | 12h 07' | 12h 03' | 12h 00' | 11h 58' | 12h 00' | ||
| Sun altitude at solar noon on the 21st day (°). | 67 | 75.4 | 86.4 | 80.9 | 72.2 | 69 | 72.4 | 81.3 | 86.7 | 75.6 | 67.3 | 64.1 | 74.8 |
Please take a moment to share a climate graph or simply the address:
Thank You, so much! ❤️